
This page is a tutorial on how to use the tool Cosmos in the platform CosyVerif. This tutorial was part of ETR13. The pdf document that was distributed to the students is available here.
The main page of the tool can be found here.
The Services Menu
CosmosInCosyVerif services are available under the “Stochastic Analysis” menu and it proposes the elements presented in the image below.
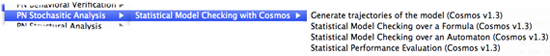
The following services are available:
- Generate Trajectories of the Model: Use the simulator to generate trajectories of a SPN and show the evolution of the number of tokens in specified places.
- Statistical Performance Evaluation: Compute the mean number of tokens in each place and the mean throughput of each transition of a SPN.
- Statistical Model Checking over an Automaton: Evaluate an HASL expression over a SPN. The HASL expression is described using an automaton. This service allows to define complex performance evaluation indices.
- Statistical Model Checking over a Formula: This service is still under development. It transforms a formula in a subset of LTL into a HASL expression and evaluate it.
The Services
Let us know detail the services.
Generate Trajectories of the Model
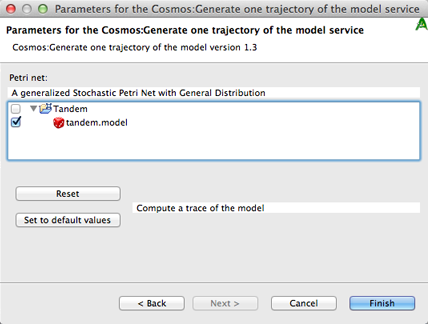
The first simple analysis we can perform on the tandem queue system is to simulate one trajectory. To do this, select one alligator server in the service menu and then select Cosmos, Generate one trajectory of the model.
A window will pop asking for some parameters. The first page of parameters contains only the length of the trajectory, the second page requires to set the model, check the box of the tandem queue model (see figure below).
Once Cosmos finishes the simulation a graphics showing the number of tokens in each place is displayed.
Statistical Performance Evaluation
A more detailed analysis can be performed by choosing the service Cosmos Statistical Perfomance Evaluation in the service menu. This service requires more parameters. You can first keep the default values and launch the service on the tandem queue system. After some time, the result will be displayed. For each place, the tool returns an estimation of the mean number of tokens looking like:
[code language=”text”]
MeanToken_Queue1:
Estimated value: 0.286221703319812
Confidence interval: [0.282671106477023 , 0.289772300162601]
Width: 0.00710119368557882
[/code]
For each transition, an estimation of the throughput is returned:
[code language=”text”]
Throughput_rho0:
Estimated value: 0.0999094999999996
Confidence interval: [0.0985010508695943 , 0.101317949130405]
Width: 0.00281689826081077
[/code]
You can modify the model by changing the rate rho0 to a value above 0.45 and observe that the system is unstable (meaning the number of tokens in a place diverges) by simulating a trajectory or computing mean number of tokens. You can also try to change the distribution of the first transition from EXPONENTIAL(rho0) to DETERMINISTIC(10) and observe the change on the trace of the simulation. You can try other distributions, the available distributions are: GAMMA, UNIFORM, EXPONENTIAL, DETERMINISTIC, LOGNORMAL, TRIANGLE, GEOMETRIC, DISCRETEUNIF and ERLANG.
Statistical Model Checking over an Automaton
To compute more complex indexes, we will use an automaton to describe them. The LHA model represents an automaton which waits for the system to reach either a state where the total number of clients in the system is equal to 0 or a state where is equal to N. In the latter case, the variable x is set to 1. Finally, the expression AVG(last(x)) makes the tool to return an estimation of the expected value of x in final states.
Launch Cosmos statistical model checker service from the service menu. This service requires an LHA, a model and several parameters which can be kept at their default values. The returned result is a confidence interval of an estimation of the expected value of x. A graph depicting the convergence of the estimation is also returned.
You can try to modify parameters of the LHA or of the Model to see the impact on the variable x. You can also try to change the calling parameters of the service to obtain tighter confidence intervals.
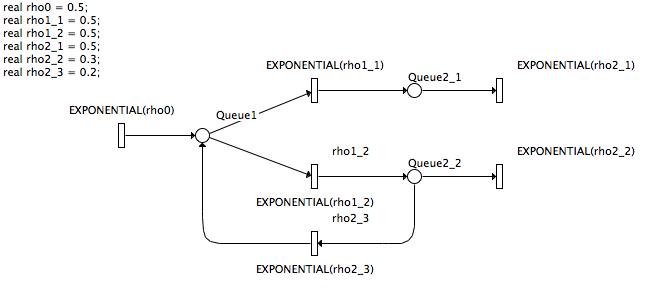
You can model a network of queues. Create a new empty model in the Cosmos formalism and build the model depicted in the following figure.
You need to name all places and transitions for the tool to accept the model.
You may now adapt the LHA of the previous example to work with this one, computing the probability for the system to reach a state containing N clients before reaching a state with no client.
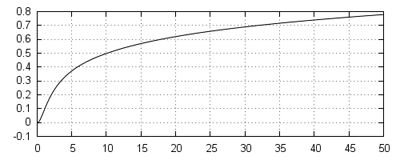
You can also build an LHA computing the average time between the first arrival of a client and the first time the system is empty. The notation for the flow of a variable is x’=c, where x is the variable and c an expression depending only on the number of tokens in some place. Assuming the variable accounting for the time is t, by replacing the HASL formula by AVG(last(t)); CDF(last(t),0.1,0.0,50.0);, the Cumulative Density Function of the random variable t is returned with the result (see figure below).
Statistical Model Checking over a Formula
No documentation yet since this service is still under development.